Audit‑grade physical risk analysis for individual assets. Explains the “why” behind risk using hazard‑specific diagnostics.
Understanding the physical risks to an individual asset requires more than a superficial glance at hazard maps; it demands high-fidelity, audit-grade analysis. Our Site Feasibility & Hazard Screening provides an empirical foundation for planning, due diligence, and site development. We deploy rigorous diagnostic modeling to unpack the complex drivers behind local hazards. We differentiate, for instance, between fluvial river floods and pluvial surface runoff, or simulate urban heat microclimates based on structural density. Beyond climate, we also cover geological risks like earthquakes, tsunamis and many others.
Rather than delivering just a generic risk score, which is just an entry-level, we can contextualize over 100 climate and geological risk indicators to explain the specific hazards of a site. The output is a transparent, scientifically validated screening package that includes mapped hazard layers, identified red flags, and traceability data. These analytics empower planners, developers, and asset managers to understand their physical risk exposure and provide immediate, grounded pointers for structural mitigation and resilience building.
We provide a comprehensive diagnostic report that moves far beyond generic risk scoring. This document isolates the specific physical drivers of risk at your exact location, identifying critical vulnerabilities and definitive "red flags." By unpacking the complex interactions between local topography, climate projections, and built infrastructure, we deliver an empirical baseline that directly informs site viability and due diligence processes.
Spatial context is vital for structural planning. We deliver high-fidelity spatial data tailored to your site, providing detailed hazard footprints and exposure layers. These map packs are designed for seamless integration into your existing Geographic Information Systems (GIS) and internal planning software. This ensures that your engineering and development teams have direct access to the exact geospatial boundaries of flood zones, heat islands, or fault lines.
Identifying a hazard is only the first step toward resilience. We accompany our risk assessments with grounded, actionable impact insights for structural and operational mitigation. Furthermore, to ensure full auditability and compliance with regulatory frameworks like the CSRD, we provide a complete data appendix. This guarantees absolute transparency regarding the underlying climate scenarios, historical data sets, and modelling methodologies utilized in our analysis.
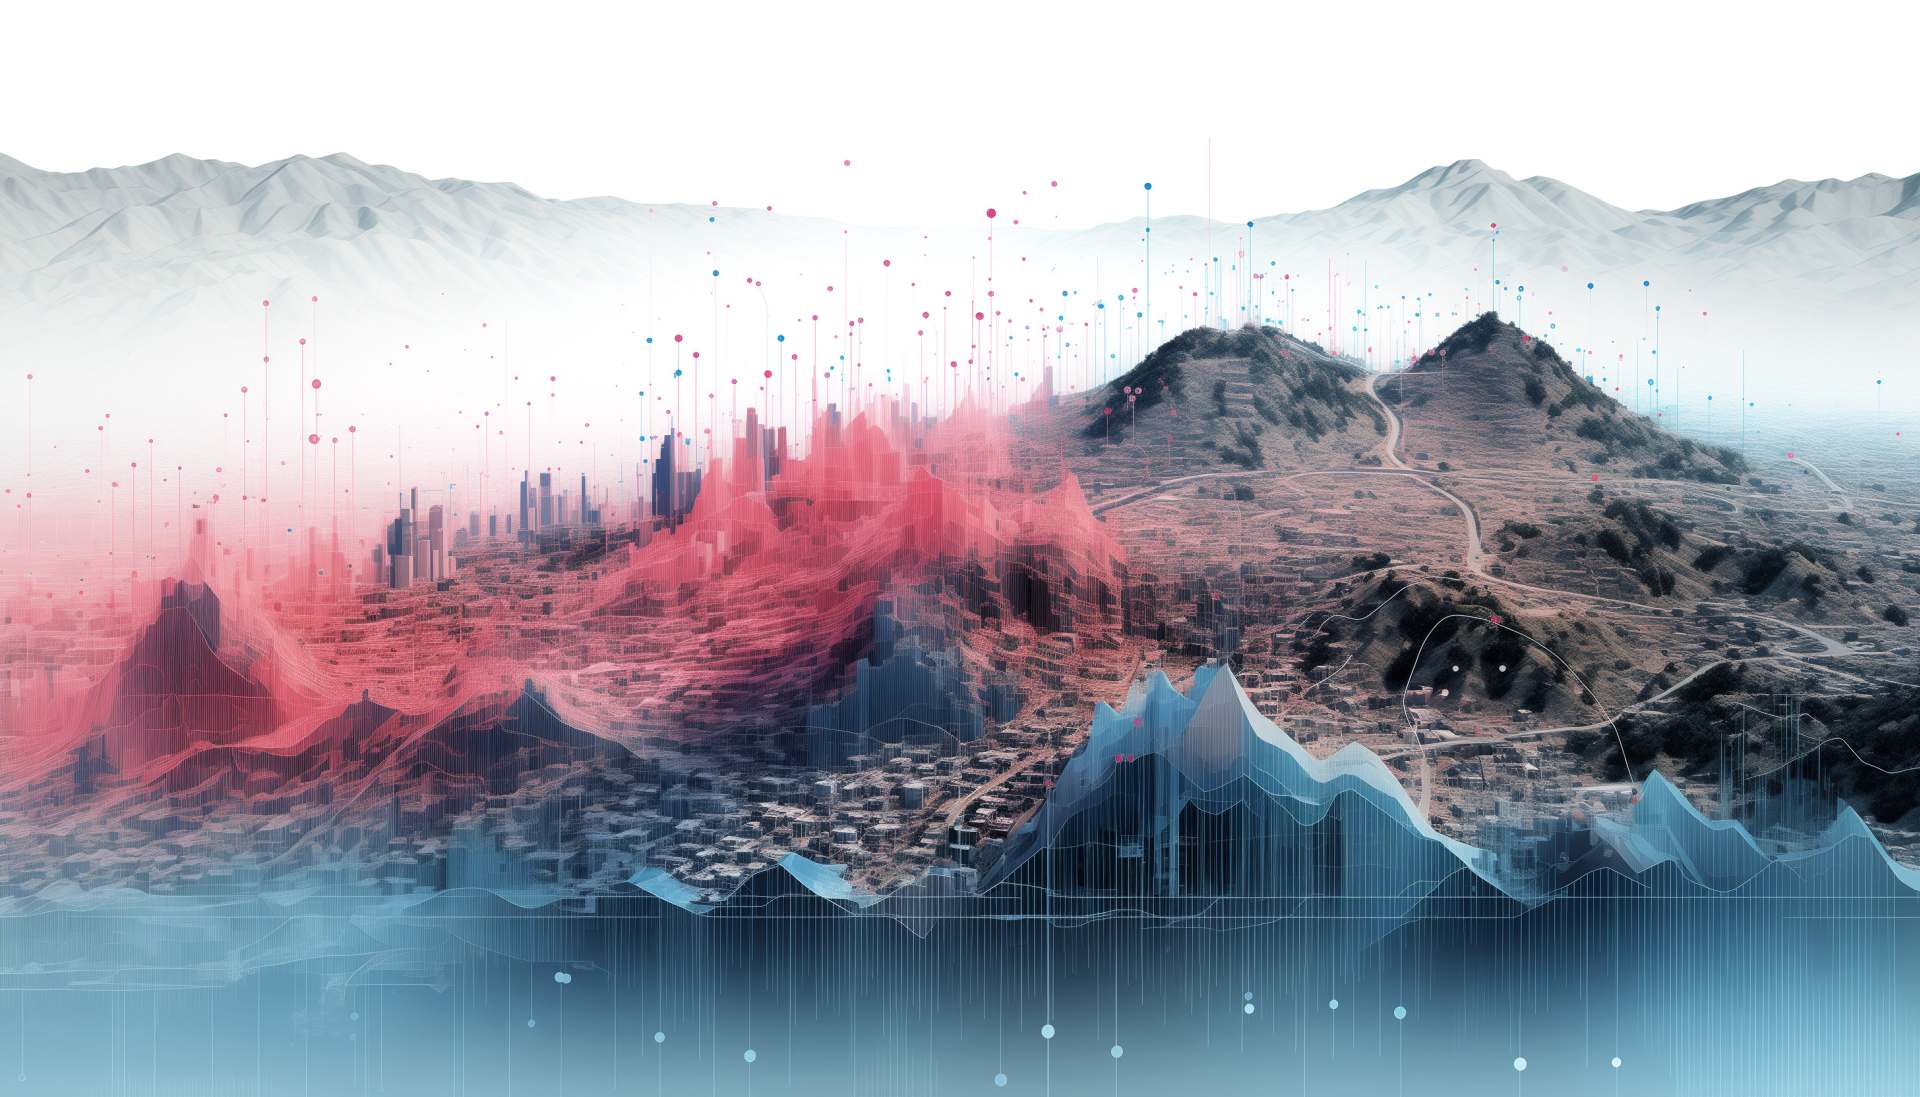
Urban heat stress is highly localized, yet traditional climate models often miss the critical nuances. We uuse a physics-based downscaling methodology that bridges this gap, transforming coarse regional climate data into precise high resolution maps. This system integrates hourly temperature curves with empirical and numerical modelling, simulating cold air drainage and the heat-trapping effects of urban landscapes. By accounting for building heights, land use effects and vegetation cooling, the interactions that drive microclimates at the street level are captured.
This granular visibility is essential for robust Site Hazard and Risk Assessments. Whether for optimizing building-level vulnerability analytics, our model provides the data fidelity required for decision-making. It is particularly valuable for compliance with CSRD, enabling organizations to quantify physical climate risks based on site-specific reality rather than regional averages. The system is designed to project these patterns onto future climate scenarios. This ensures that assessments made today account for the intensifying heat of tomorrow.
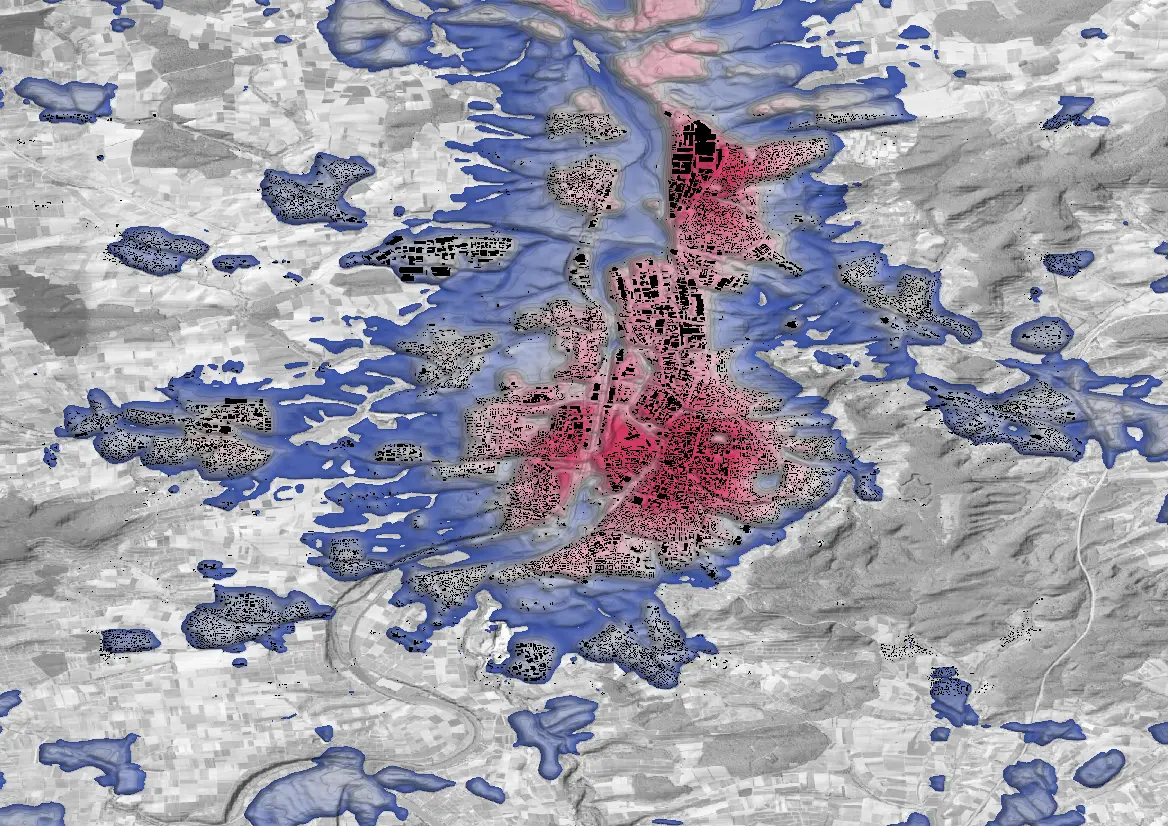
Traditional flood maps often rely on outdated historical data and fail to distinguish between different inundation mechanisms. Our flood & surface runoff Simulations utilize high-resolution digital elevation models (DEMs) and physics-based hydrological routing to accurately predict water flow and depth at the asset level.
We explicitly differentiate between fluvial (riverine) flooding and pluvial (flash) flooding, the latter of which is increasingly driven by intense precipitation events overwhelming local drainage capacities and sealed urban surfaces. By simulating surface water flow pathways and accumulation zones under various extreme weather scenarios, we provide a highly localized understanding of inundation risks. We also take into account local flood protection and control structure, an important element often missing in generic flood models.
While climate change dominates current risk discourse, geological hazards present immediate, catastrophic threats to site feasibility that cannot be ignored. Our Geological Risk Scan provides a rigorous assessment of local tectonic and geomorphological vulnerabilities. Utilizing global fault databases, historical seismic catalogs, and localized site conditions, we quantify the probability and potential intensity of earthquakes, tsunamis, landslides, and soil liquefaction.
We evaluate ground acceleration metrics, intensity spectra and terrain stability to identify underlying geological weaknesses that could compromise structural integrity from remote sensing. This is essential for heavy industry, critical infrastructure, and large-scale real estate developments, ensuring that engineering parameters and site selection are firmly rooted in empirical geosciences.
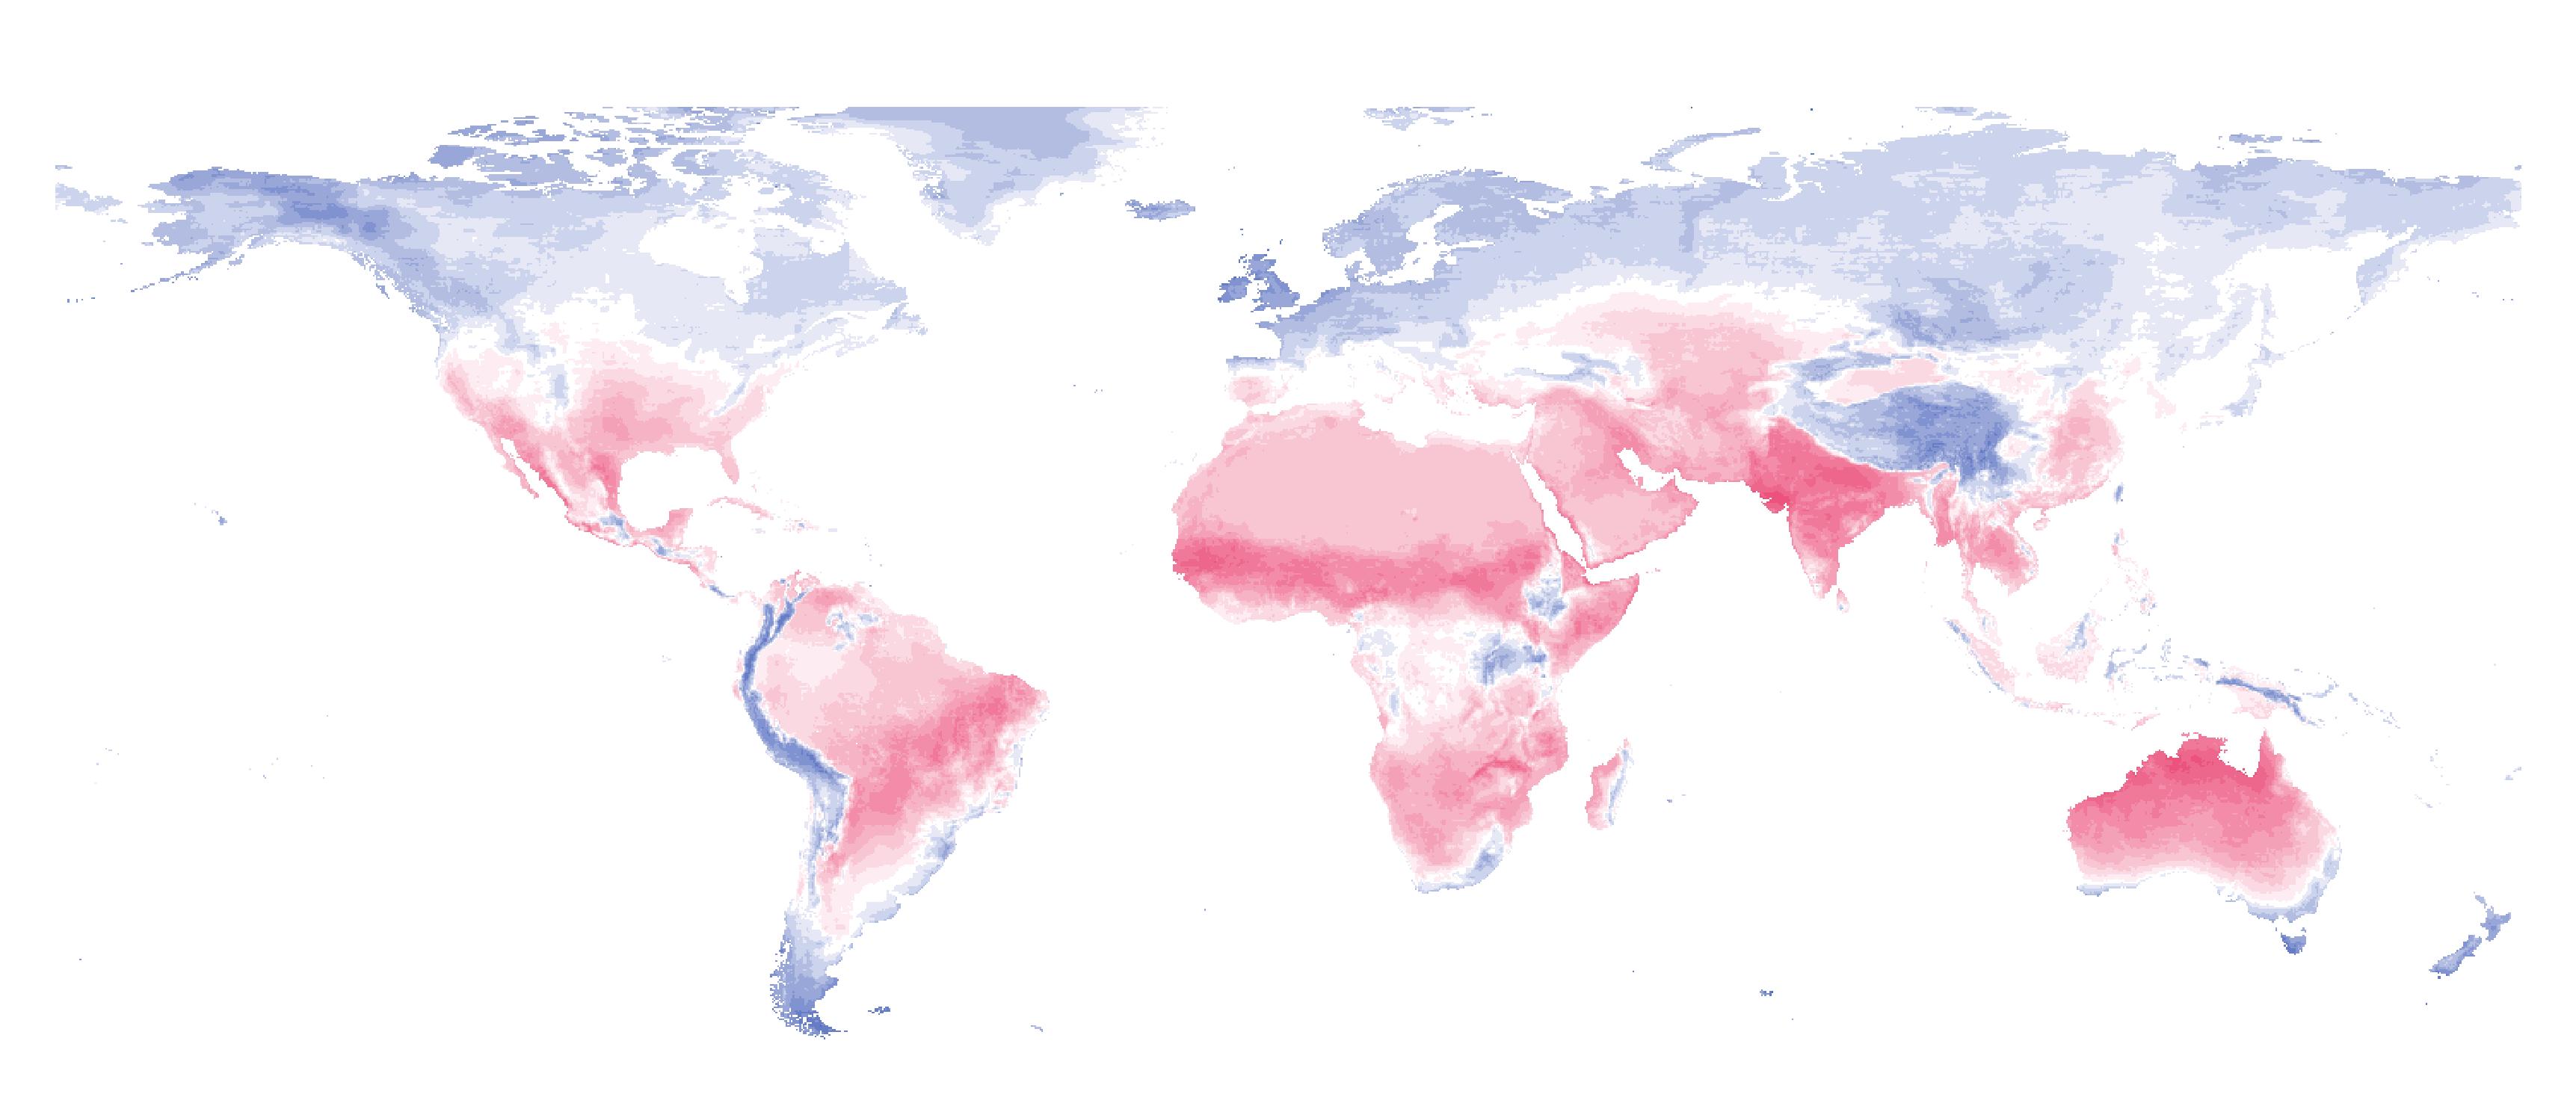
Our Climate Risk Indicators provide a robust, flexible framework to assess climate-related hazards across locations, assets, and sectors. We combine a wide range of quantitative and qualitative indicators to capture perils such as heat and heat stress, cold and cold stress, wildfire, precipitation extremes, and drought. Each peril is represented through multiple complementary indicators, reflecting different physical drivers and impacts.
To translate hazard information into actionable insight, we aggregate indicators into peril-level indices that are tailored to asset-specific and regional vulnerabilities, ranging from individual buildings and infrastructure to travel destinations and supply chains. The methodology integrates high-resolution observational datasets, state-of-the-art climate reanalyses, and proprietary modelling approaches.
Future climate conditions are captured using established scenarios (e.g. SSP2-4.5 and SSP5-8.5), with trends validated against global and regional climate models and observations. The result is a transparent, scalable basis for site-level hazard assessments, CSRD reporting, and forward-looking vulnerability and risk analyses.
As climatic baselines shift, the threat of catastrophic wildfire is expanding into previously unaffected regions. Our wildfire susceptibility mapping integrates high-resolution satellite imagery, local topography, and historical climate reanalyses to model ignition probabilities and fire spread.
By analyzing localized vegetation types (fuel loads), slope gradients, and prevailing wind corridors, we determine the risk footprint of wildfire sucseptibility for specific assets under today's and future climate conditions.
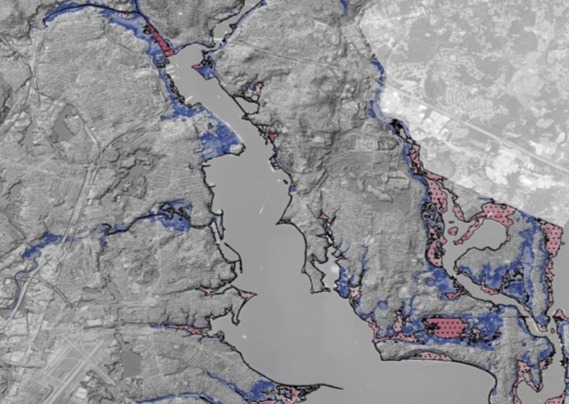
Coastal assets face compounding threats from long-term sea-level rise and the increasing intensity of severe cyclonic events. Our Analytics combine bathymetric data and coastal topography with hazard drivers like sea level rise, storm surge or tsunami wave heights. We assess the physical impact of these forces on coastal infrastructure, identifying elevation thresholds for asset safety.
By projecting these risks against multiple future climate scenarios, we provide the scientific evidence required to optimize coastal resilience.

Scenario processing and large‑portfolio workflows that translate scientific metrics into decision‑ready outputs for investment and reporting.
Converting hazard exposure into tangible metrics and “Red Flag” lists for investment decisions.
Providing scientifically validated climate scenario aligned risk metrics and taxonomy alignment (e.g., EU Taxonomy/CSRD support).
Rigorous portfolio-wide stress tests against diverging climate scenarios.
Closing data gaps to ensure accurate geographic mapping.